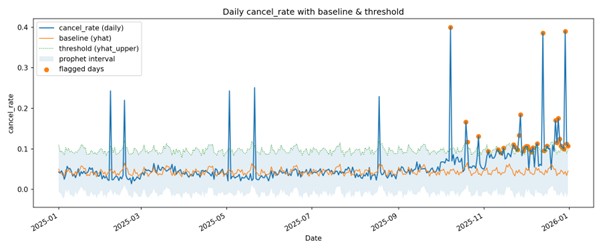
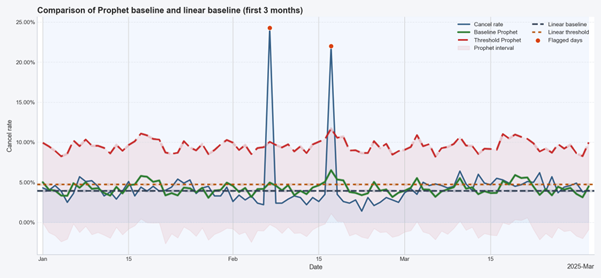
Prophet: ~3X fewer false alerts after adding a forecasting layer to our custom AI agent for anomaly detection.
- 01.19.2026
Scalable AI Agents you can trust
The Additive Structure Behind Prophet
Time-series forecasting often feels harder than it should be. Real-world data is messy: trends shift, seasonality changes, holidays distort patterns, and gaps or outliers are common. Prophet was designed with exactly this reality in mind, offering a pragmatic model that balances statistical rigor with usability.
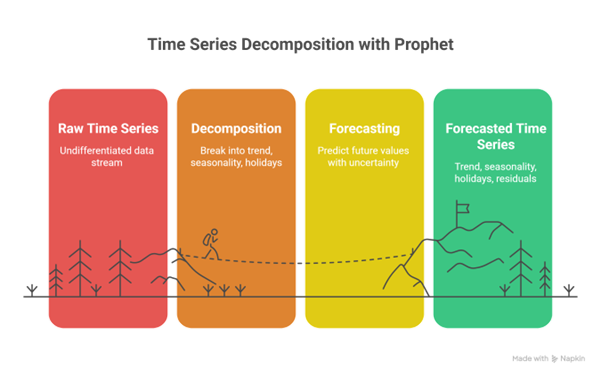
At a high level, Prophet assumes that any time series can be decomposed into a small number of interpretable components:
y(t) = g(t) + s(t) + h(t) + ε
This structure is not just convenient—it reflects how many real processes behave. Long-term growth or decline is captured by the trend component g(t). Repeating patterns such as weekly or yearly cycles are handled by the seasonal term s(t). Known, external disruptions (like holidays, promotions, or system changes) can be explicitly modeled through h(t), while ε accounts for random noise.
Because each part is modeled separately, Prophet makes it easy to reason about forecasts and diagnose where changes in the data are coming from.
How Trend Modeling Works in Theory
The trend component is where Prophet does much of its heavy lifting. Rather than fitting a single global trend, Prophet models growth as a piecewise function—typically linear or logistic. The model automatically places changepoints along the timeline where the growth rate is allowed to shift.
From a theoretical perspective, this approximates non-stationary behavior without explicitly differencing the data. Regularization plays a key role: while many potential changepoints are considered, a prior discourages large or frequent changes unless the data strongly supports them. This Bayesian regularization helps prevent overfitting and keeps the trend smooth and interpretable.
Seasonality as a Flexible Basis Expansion
Seasonality in Prophet is modeled using Fourier series, which provide a compact and flexible way to represent periodic patterns. Instead of assuming a fixed shape for seasonality, Prophet learns a combination of sine and cosine terms that best fit the data.
Theoretically, this can be viewed as projecting the time series onto a set of periodic basis functions. The result is a smooth seasonal component that can capture complex but stable cycles.
Depending on the data, this component can be added directly to the trend (additive seasonality) or scaled by it (multiplicative seasonality), allowing seasonal effects to grow or shrink with the level of the series.
A Bayesian Framing and Uncertainty
Although Prophet feels like a deterministic tool, it is grounded in a Bayesian framework. Priors are placed on key parameters such as trend changes and seasonal coefficients, and forecasts are generated by sampling from the posterior distribution.
This enables Prophet to produce uncertainty intervals rather than just point estimates. These intervals reflect both observation noise and uncertainty in the model parameters, which is especially useful for anomaly detection where deviations outside the confidence range are meaningful.
Why This Theory Matters in Practice
What makes Prophet compelling is how this theoretical foundation translates into practical benefits. The additive structure keeps the model interpretable. Piecewise trends handle structural changes gracefully. Fourier-based seasonality captures recurring patterns without manual feature engineering. And the Bayesian framing provides uncertainty estimates that support better decision-making.
Just as importantly, Prophet is forgiving. It handles missing data and outliers reasonably well without heavy preprocessing, reducing the time spent cleaning data before you can get insights.
Simple Knobs, Real Leverage
Prophet’s design philosophy favors a small number of meaningful tuning parameters. Adjusting the interval width or the changepoint prior can significantly change model behavior without requiring deep expertise in time-series theory.
In short, Prophet shines not because it’s the most complex model, but because it’s transparent, robust, and practical—qualities that matter when forecasting real-world data.