Cognitive Cartography: A Better Way to Explain the AI Black Box
- 03.26.2026
As AI systems become more multimodal, more powerful, and more embedded in business decisions, one question keeps getting louder: how do we make these models make sense? Not just to data scientists, but to business leaders, CX teams, and domain experts who need to trust the output, challenge it, and act on it. That is why cognitive cartography is so compelling. It offers a way to move beyond the black box by making AI’s internal understanding visible, navigable, and explainable through examples.
From feature engineering to human-centered understanding
Traditional feature engineering was built to help machines. It transforms raw data into model-friendly inputs that improve prediction, often by compressing complexity into abstract variables. That works well when the goal is accuracy alone. But in a world of human-AI collaboration, accuracy is not enough. Business users need to understand how information clusters, how concepts relate, and why the model arrived at a conclusion. Cognitive cartography extends the logic of feature engineering into something more human-centered: instead of only asking how to optimize data for the model, it asks how to organize information so people can navigate it, interpret it, and reason with it.
This matters even more now because business questions rarely live in one clean data set. The real challenge in analytics is connecting distinct domains: customer conversations, emails, transactions, product usage, documents, images, pricing decisions, team workflows, and external signals. Foundation models can help bridge those domains, but only if the result is understandable. For many business contexts, hallucination is not acceptable. Leaders do not just want an answer; they want supporting examples, adjacent evidence, and a way to inspect the logic behind the answer. Cognitive cartography helps by turning latent AI representations into visual, layered landscapes that people can actually explore.
Why representation learning makes this possible
At the heart of modern AI is representation learning: models learn meaning by building hierarchies from simple signals to more abstract concepts. In images, that might start with edges and textures, then shapes, then objects, then scenes. In language, words with similar meanings end up near one another in embedding space, and sentences with related ideas cluster together. The same principle can extend across multimodal data, where text, structured business records, images, graphs, or even scientific data can be mapped into a shared conceptual space.
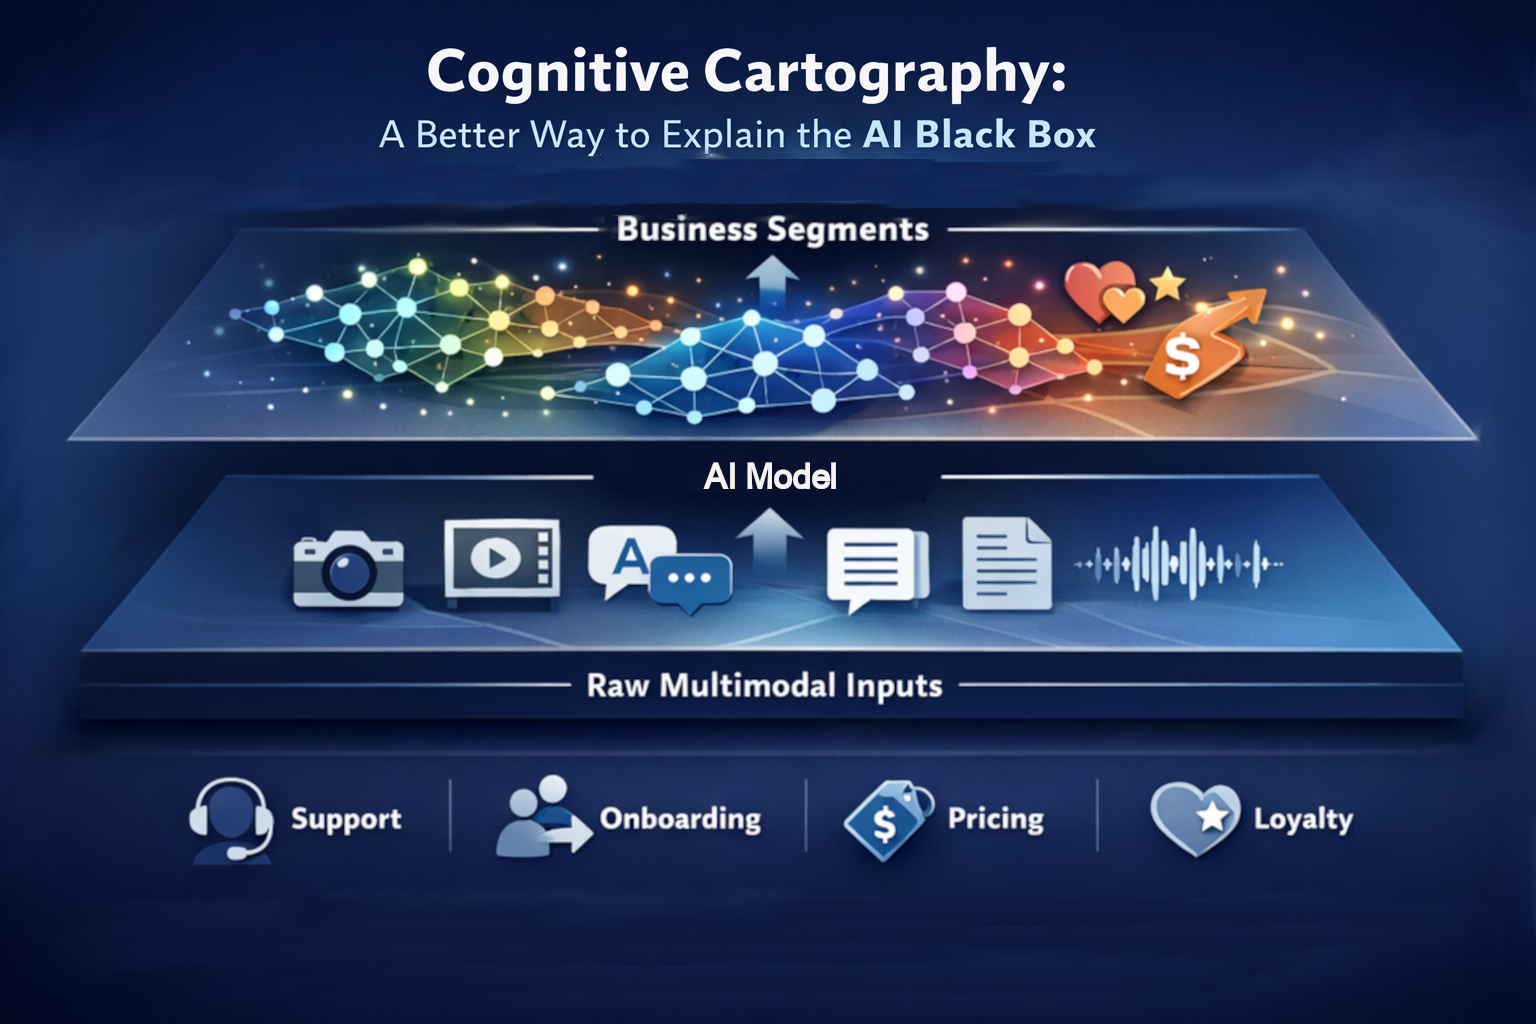
Cognitive cartography makes that invisible structure visible. At the lowest layer, the model estimates concepts and relationships. As you move upward, those concepts are grouped into broader patterns. At the top, business users can work with intelligible segments: clusters they can label, rename, compare, question, and refine. That is the real breakthrough. Instead of forcing all intelligence through a chatbot interface, we give people a map of how the system understands the domain. Users can inspect clusters, ask what makes one segment different from another, request examples, and redefine labels in ways that align with business reality. Those human-defined labels can then become high-value training data for fine-tuning or specializing models.
A practical example: customer journey mapping in CX
This is especially powerful in customer experience. Customer journeys are rarely linear, and they are almost never captured in a single source. The real journey lives across survey comments, service tickets, call transcripts, clickstream behavior, product usage, complaints, purchase history, and even agent notes. A foundation model can detect patterns across all of that, but without a transparent structure, the insights remain hard to trust and harder to operationalize.
Now imagine applying cognitive cartography to that journey. At the lower levels, AI identifies fine-grained concepts such as friction during onboarding, confusion around pricing, repeated contact for the same issue, urgency signals, or signs of loyalty risk. At higher levels, those concepts can be grouped into larger segments such as “customers struggling to get started,” “high-value customers experiencing service breakdown,” or “price-sensitive customers seeking reassurance.” At the top layer, a CX leader can inspect those segments directly, relabel them, merge or split them, and ask for representative examples from each group. That creates a deterministic, evidence-based view of the journey—one that is far more actionable than a generic summary. It also creates labeled knowledge that can be reused to train better specialized models for future decisions.
Why visual AI matters now
This is why visual AI is not just a nice interface layer. It is becoming essential infrastructure for trustworthy business AI. When people can see how information is organized, how clusters form, how concepts evolve over time, and how different parts of the business connect, they are far more able to work with AI rather than simply consume it. The deck’s reference to the Mantis visual data science approach is a strong example of this direction: giving users the ability to compare clusters, inspect distances, summarize groups, and explore differences interactively. That kind of transparency helps put humans back in the middle of the system, where they belong.
Cognitive cartography will not eliminate the complexity of modern AI. But it gives us a much better way to live with that complexity: by exposing the conceptual layers beneath the model, grounding answers in examples, and allowing business users to shape the labels and segments that matter most. In a world where AI systems are growing more powerful and more opaque at the same time, that may be one of the most important capabilities we can build.